The market for secondary raw materials, which includes recycled metals, plastics, wood, paper, and other reusable commodities, plays a crucial role in global supply chains by reducing waste, conserving natural resources, and offering sustainable alternatives to primary raw materials. As the world faces increasing environmental challenges, such as resource depletion and climate change, the demand for secondary raw materials has surged. These materials contribute to a circular economy by extending the lifecycle of resources but also help industries reduce their carbon footprint and dependence on virgin materials.
The secondary raw materials market is deeply intertwined with various sectors, including manufacturing, construction, and consumer goods, all of which rely on a steady supply of materials to produce new products. As this market grows, understanding its interconnections with other financial assets—such as foreign exchange (FX) pairs, stock indices, and primary commodities like gold, copper, and oil—becomes increasingly important for stakeholders ranging from investors to policymakers. The price movements in secondary raw materials can be influenced by a wide range of factors, including changes in global economic conditions, shifts in demand for primary raw materials, and fluctuations in currency exchange rates. These interconnected dynamics mean that the market for secondary raw materials does not operate in isolation but rather is affected by and can influence broader financial markets.
One of the most effective tools for analysing these interconnections is the correlation matrix. This analytical tool allows stakeholders to quantitatively assess the relationships between the prices of secondary raw materials and other financial assets. By providing a clear visual representation of how different assets move in relation to each other, the correlation matrix helps identify patterns, co-movements, and potential areas for diversification or risk management. For example, a strong positive correlation between recycled copper and primary copper may indicate that trends in the primary market directly impact the recycled market. Conversely, a negative correlation between recycled plastics and crude oil could suggest that these materials respond differently to changes in oil prices, potentially due to varying factors like supply chain disruptions or changes in recycling technology.
In summary, the correlation matrix is not just a tool for financial analysis; it is a critical component in the strategic toolkit for anyone involved in or affected by the secondary raw materials market. As this market continues to expand and evolve in response to global challenges, the ability to understand and navigate its complex interconnections with other financial assets will become increasingly vital.
The DigInTraCE project (EU-funded Horizon Europe project - Grant Agreement No. 101091801) particularly aims to enhance transparency and interoperability in the market for secondary raw materials through advanced digital traceability and data analysis tools. In this context, the use of a correlation matrix becomes essential for understanding the complex interconnections between secondary raw materials, primary commodities, foreign exchange pairs, and stock indices. By incorporating correlation matrices within DigInTraCE’s financial toolkit, developed by Hypertech, we can support stakeholders in identifying market relationships, managing risks, and optimizing supply chain decisions. For example, the project's AI-driven decision-making mechanisms can leverage correlation data to predict price movements, assess fluctuation risks, and develop financial tools for hedging and diversification. This approach also aligns with DigInTraCE's goal of creating innovative business models and economic opportunities by providing stakeholders with critical insights into the dynamics of secondary raw materials markets and their interplay with broader financial markets. In the following paragraphs of this post we analyse in more depth how a correlation matrix is computed, what is its importance and its utilization and practical examples in the context of DigInTraCE.
What is a Correlation Matrix?
A correlation matrix is a table showing correlation coefficients between variables. Each cell in the table shows the correlation between two assets, indicating how closely they move together. Correlation coefficients range from -1 to 1:
- 1 indicates a perfect positive correlation: the two assets move in the same direction.
- -1 indicates a perfect negative correlation: the two assets move in opposite directions.
- 0 indicates no correlation: the movements of the two assets are unrelated.
To calculate a correlation matrix, we use historical price data of the assets involved, such as secondary raw materials, primary commodities, FX pairs, and stock indices. The correlation coefficient between two assets is computed using the Pearson correlation formula, which measures the linear relationship between the two variables. The formula for calculating the correlation coefficient (ρxy) between two assets, X and Y, is given by:
where Cov(X,Y) is the covariance of the two assets, and σX and σY are the standard deviations of X and Y respectively. The covariance measures how two variables move together, while the standard deviations measure the individual volatility of each variable. To construct the full correlation matrix, this calculation is repeated for each pair of assets in the dataset, resulting in a symmetric matrix where each element represents the correlation between two assets.
For example, if we have a dataset that includes historical prices for recycled aluminium, copper, oil, the S&P 500 index, and the EUR/USD exchange rate, we would first calculate the daily returns for each asset. Then, using these returns, we would compute the correlation coefficients for each pair of assets to fill in the matrix. The resulting correlation matrix provides a comprehensive overview of how the prices of secondary raw materials interact with primary commodities, stock indices, and FX pairs. This matrix can be updated regularly to reflect the latest market conditions, helping investors and businesses stay informed about evolving relationships between these assets.
Importance of the Correlation Matrix
Risk Management and Diversification: A key advantage of a correlation matrix is its ability to identify diversification opportunities. By investing in assets with low or negative correlations, investors can reduce the overall volatility of their portfolios. For instance, if a secondary raw material such as recycled aluminium has a low correlation with traditional commodities like oil or gold, adding it to a portfolio could lower risk without significantly impacting returns.
Identifying Market Relationships and Trends: The correlation matrix helps market participants identify and understand the relationships between secondary raw materials and other asset classes. For example, a high correlation between recycled plastics and oil prices might suggest that movements in oil influence the price of recycled plastics, given that plastics are petroleum-based. Similarly, correlations between secondary metals like recycled copper and traditional copper can indicate how closely the recycling market follows the primary metals market.
Assessing Macro-Economic Sensitivities: Secondary raw materials can also show sensitivity to broader economic factors that affect FX pairs and stock indices. For instance, if recycled metals have a strong correlation with industrial stock indices, this could imply that they are sensitive to broader economic growth and industrial activity.
Hedging Strategies: For companies involved in the trading or usage of secondary raw materials, the correlation matrix can be a valuable tool in formulating hedging strategies. Understanding how these materials correlate with major commodities or FX rates allows companies to hedge their exposures more effectively. For instance, if recycled steel is highly correlated with EUR/USD exchange rates, companies can use FX futures or options to mitigate currency risk.
Practical Examples
Correlation with Primary Commodities
Suppose a correlation matrix reveals that recycled copper has a 0.8 correlation with primary copper prices. This suggests that movements in primary copper prices significantly affect recycled copper, indicating that market participants should watch primary markets closely when trading recycled materials.
Correlation with FX Pairs
If the matrix shows a negative correlation between recycled aluminium and the USD/JPY pair, this might indicate that a stronger dollar against the yen puts downward pressure on recycled aluminium prices, possibly due to increased import costs or shifts in international demand.
Correlation with Stock Indices
A positive correlation between a stock index like the S&P 500 and recycled plastics might highlight that the demand for recycled plastics is linked to broader economic activity, as reflected by the stock market. This insight is particularly valuable for investors predicting demand based on economic cycles.
Utilising the Correlation Matrix in Decision-Making
Investment Decision-Making: Investors use the correlation matrix to construct well-diversified portfolios by combining assets with low or negative correlations, balancing their exposure to different markets and economic sectors.
Strategic Business Planning: Companies involved in the secondary raw materials market can use the correlation matrix to plan their operations better. Understanding correlations can help companies anticipate market moves and adjust procurement, pricing, and inventory strategies accordingly.
Policy and Regulation Insights: Policymakers and regulators can use correlation matrices to understand how changes in one market segment might ripple through others, helping to design more effective market interventions or sustainability initiatives.
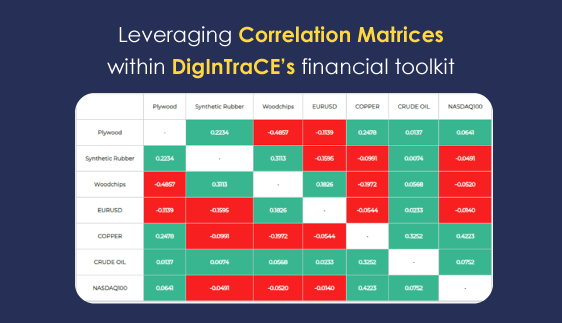
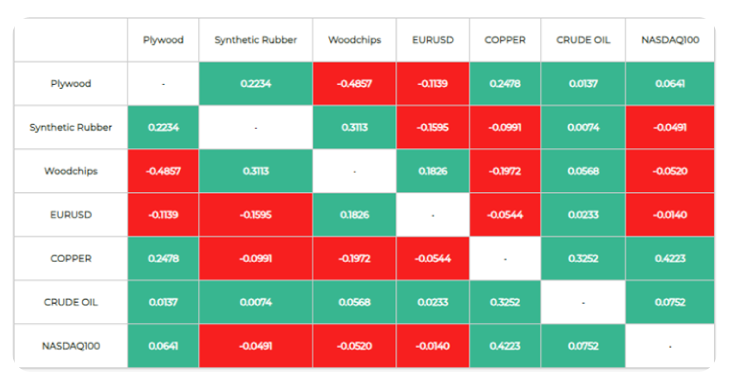
The image below visually represents a correlation matrix, highlighting the significant relationships between various secondary raw materials, such as recycled wood and plastics, and other financial assets, including primary commodities, stock indices, and foreign exchange pairs. The matrix reveals some significant correlations between secondary raw materials and assets of the traditional markets.
Conclusion
The correlation matrix is an indispensable tool in the secondary raw materials market, providing critical insights into the interconnectedness of various assets. By understanding these correlations, investors, companies, and policymakers can make more informed decisions, mitigate risks, and capitalize on opportunities across different market conditions. As the demand for sustainable and recycled materials continues to grow, leveraging tools like the correlation matrix will be key to navigating the complexities of these evolving markets.
Disclaimer: Views and opinions expressed are those of the author(s) only and do not necessarily reflect those of the European Union or HADEA. Neither the European Union nor the granting authority can be held responsible for them.